Image


Why are fewer people riding public transit, and what do lower farebox revenues mean for state and federal government in their oversight and support of transit agencies? In an article published last year in the Municipal Finance Journal, our research team at the Institute of Government and Public Affairs developed some hypotheses for a possibly permanent decline in commuting: many workers became accustomed to working from home during the COVID-19 pandemic and have been hesitant to return to working in the office (Funderburg et al. 2023). With data now in hand, our research team is preparing algorithms of artificial intelligence to test the hypotheses and train computers to make good predictions of where future investments in transit will be needed.
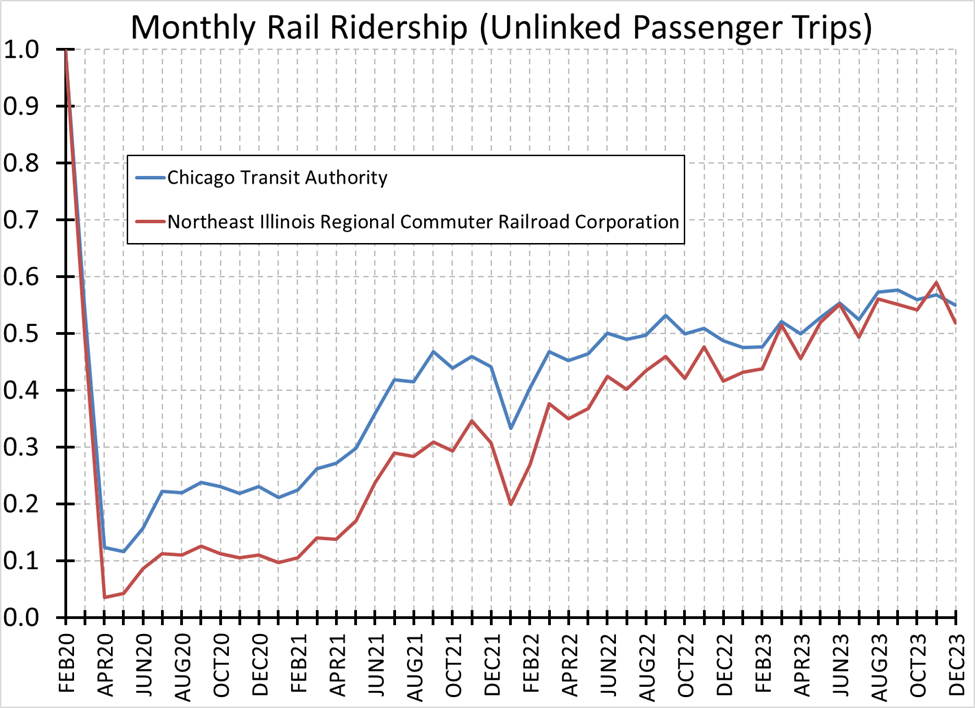
In March and early April of 2020, 45 U.S. states issued some form of order for nonessential workers to stay at home as the new coronavirus spread quickly throughout the country; seven orders were advisory, the rest mandatory. One result was an immediate and dramatic decline in the number of riders using public transit. Nearly four years later, data continue to suggest that neither ridership nor farebox revenues will recover to their pre-pandemic levels in the foreseeable future. Across the United States, transit ridership is about 71 percent of the level of ridership before the pandemic. Smaller transit systems in medium-sized cities have been more successful at recovering riders than the nation’s largest transit systems in its densest urban agglomerations, and bus services have recovered more riders than train services. For example, the figure below illustrates that that ridership on Chicago’s “L” (Chicago Transit Authority) and “Metra” (Northeast Illinois Regional Commuter Railroad Corporation) services is still below 60 percent of their pre-pandemic levels.
The stubbornly slow ridership recovery rates translate into substantially lower farebox revenue and large budget gaps for the nation’s largest transit agencies. The Regional Transportation Authority, which administers the CTA and Metra services, has an estimated budget shortfall exceeding $700 million, and it is not alone among major city transit systems with budget deficits: Boston with more than $400 million in shortfall, New York with more than $2.5 billion, Philadelphia with nearly $270 million, and San Francisco with around $350 million in expected annual budget gaps within the next few years. Public transportation systems have relied on substantial revenue support from the federal government to continue providing services while limiting the size of local budget deficits, but those funds will cease to continue after September of this year. The situation means we need methods to determine where to make investments of scarcer resources for public transit services in the future. The focus on large transit agencies does not mean small agencies are immune. The smaller urban and rural agencies of downstate Illinois have combined estimated budget shortfalls totaling less than $20 million, in amounts important to the individual agencies facing the shortfalls.
If agencies serve fewer riders, should investments in transit services decline? Yes and no—this equivocation is why our research is timely and relevant. Not all workers can work from home. Some workers will continue to depend on the availability of services no matter what other workers do, and people that continue to rely on the services represent potentially disparate impacts from future investments. Hence, we need to understand where reductions in demand for transit services are continuing post-pandemic, to where the workers were going who no longer use the system and from where they were coming, the characteristics of the workers who continue to rely on the system, where they live, and where they continue to commute to work, and how the system’s levels and quality of services contribute to ridership. A course in elementary economics teaches us that transit ridership is an equilibrium between supply and demand. The ability and choice of a significant number of workers to work from home is not the entire explanation for a lagging ridership recovery. There is also some evidence of reduced service frequency and reliability due to staffing shortages and lower quality of services measured as an increase in incidents of crime, which can deter otherwise loyal riders.
With a large amount of cell phone tracing data that records workers’ journey to work, our team is injecting new life into an old idea. We use cell phone tracing data to train artificial intelligence algorithms on the trip distribution problem of the 4-step travel demand forecasting model. The 4-step model was designed and first used by the Chicago Area Transportation Study in the 1950s, and it continues to be a workhorse for travel demand forecasting by transportation planners today. The model has undergone some improvements, most notably by physicists at the Los Alamos National Laboratory in the 1990s. Today, wider access to supercomputers and artificial intelligence makes our project practical and useful for adoption by government agencies. The trip distribution problem estimates the flows of commuters from residences to workplace, and hence it illuminates the characteristics of the neighborhoods where people live who continue to rely on the system and the characteristics of the job centers where commuters work. In addition to generating new predictive capabilities to identify transit routes in need of future investments, the models will help answer questions about the usefulness of industry-mix and occupational-mix measures for estimating work-from-home behavior. If the simple measures explain commuting behaviors well, they can be readily used by city and regional planners to prepare for office building conversion, transit-oriented development, residential or business attraction, and other forms of redevelopment needed as some job centers adjust to the new economic reality.

Richard Funderburg is co-lead of the Fiscal and Economic Policy Working Group at the Institute of Government and Public Affairs and Associate Professor of Public Management and Policy in the College of Public Affairs and Education. He researches economic impacts of government programs and community economic development. Dr. Funderburg is leading a project that is developing artificial intelligence algorithms to predict future needs for investments in public transit services.
Funderburg, Richard, Kenneth Kriz, David Merriman, & Yonghong Wu. 2023. “Effects of Post-COVID Work from Home on the Spatial Distribution of Local Government Revenues in Illinois,” Municipal Finance Journal, 44, 65-92.